S&P500 Trading Update 21/4/26

S&P500 Trading Update 21/4/26
***QUOTING ES1! FOR CASH US500 EQUIVALENT LEVELS, SUBTRACT POINT DIFFERENCE***
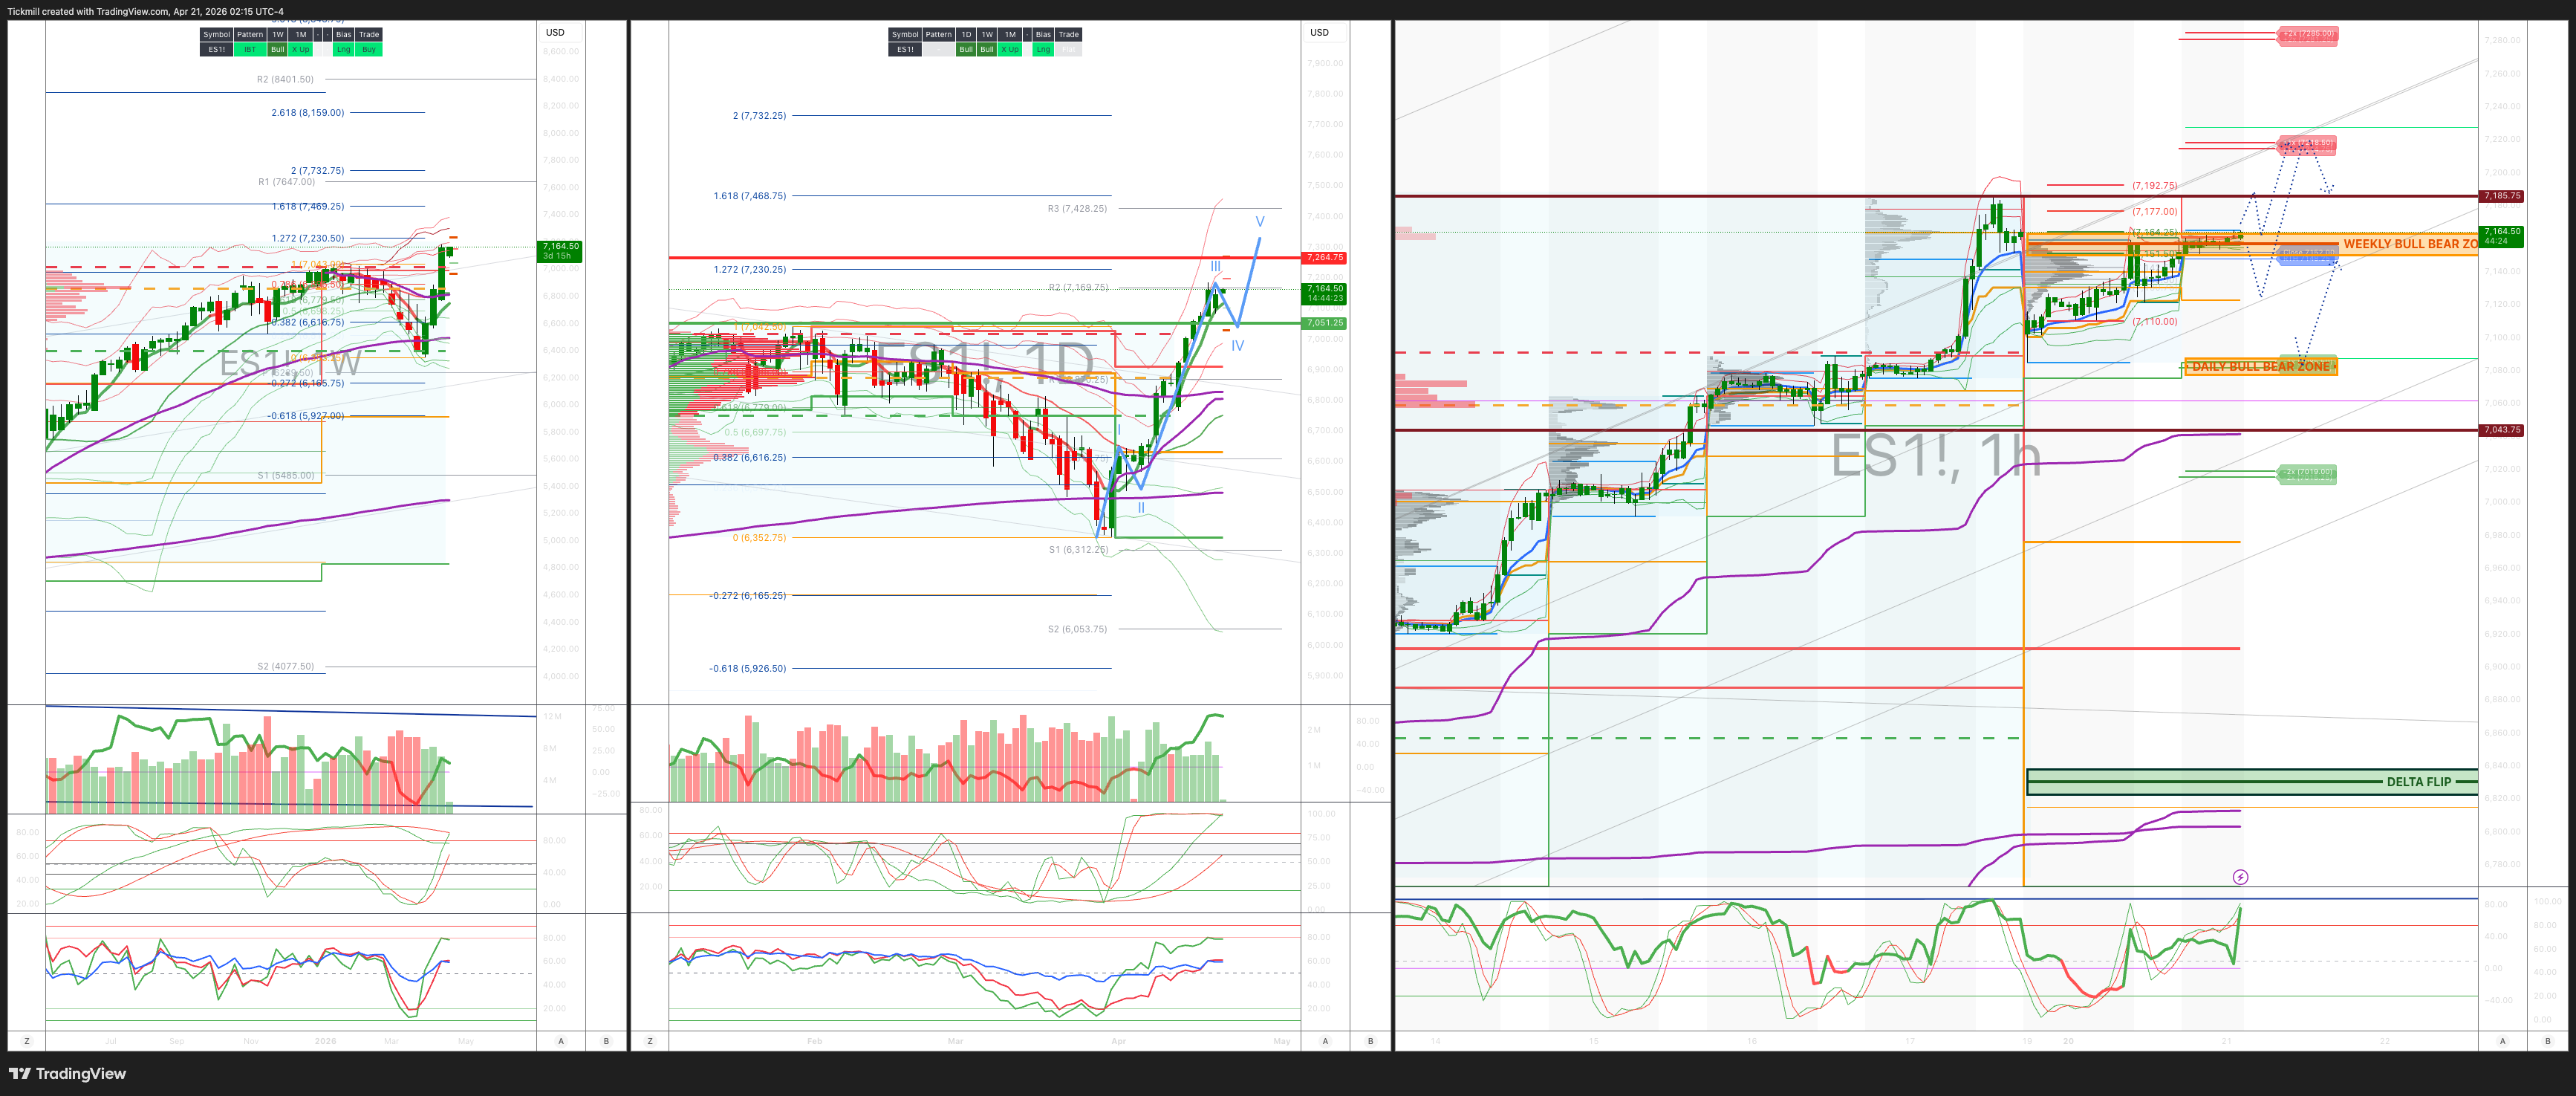
WEEKLY BULL BEAR ZONE 67150/60
WEEKLY RANGE RES 7262 SUP 7050
May OPEX Straddle: 225pt range implies a OPEX to OPEX range of [6900, 7350]
June QOPEX Straddle is 546.4pt giving us a range of [5960,7052]
JHEQX Q2 Collar 6189/6290 - 6865/6955
DEC2025 OPEX to DEC2026 OPEX is 945 points giving us a range of [5889,7779]
SPX PUT/CALL RATIO 1.17 (The numbers reflect options traded during the current session. A put-call ratio below 0.7 is generally considered bullish, and a put-call ratio above 1.0 is generally considered bearish)
DAILY VWAP BULLISH 7113
WEEKLY VWAP BULLISH 6825
MONTHLY VWAP BULLISH 6815
DAILY STRUCTURE – OTFH - 7121
WEEKLY STRUCTURE – OTFH - 6826
MONTHLY STRUCTURE - OTFD - BALANCE
Balance: This refers to a market condition where prices move within a defined range, reflecting uncertainty as participants await further market-generated information. Our approach to balance includes favouring fade trades at the range extremes (highs/lows) while preparing for potential breakout scenarios if the balance shifts.
One-Time Framing Higher (OTFH): This represents a market trend where each successive bar forms a higher low, signalling a strong and consistent upward movement.
One-Time Framing Down (OTFD): This describes a market trend where each successive bar forms a lower high, indicating a pronounced and steady downward movement.
DAILY BULL BEAR ZONE 7085/75
DELTA FLIP 6831
DAILY RANGE RES 7214 SUP 7081
2 SIGMA RES 7291 SUP 7015
VIX BULL BEAR ZONE 19.5
TRADES & TARGETS
LONG ON REJECT/RECLAIM OF DAILY BULL BEAR ZONE TARGET WEEKLY BULL BEAR ZONE
***ADDITIONAL SETUPS & TARGETS HIGHLIGHTED ON THE CHARTS***
(I FADE TESTS OF 2 SIGMA LEVELS ESPECIALLY INTO THE FINAL HOUR OF THE NY CASH SESSION AS 90% OF THE TIME WHEN TESTED THE MARKET WILL CLOSE ABOVE OR BELOW THESE LEVELS)
GOLDMAN SACHS TRADING DESK VIEW - ‘Calm Start’
US equities delivered a mixed and relatively subdued start to the week, with geopolitical uncertainty and a heavy earnings calendar keeping client engagement restrained. The S&P 500 fell 24bps to 7,109, while the Nasdaq 100 declined 31bps to 26,590, snapping its 13-session winning streak. By contrast, the Russell 2000 outperformed, rising 58bps to 2,793, while the Dow Jones Industrial Average was broadly flat, down just 1bp to 49,443. Closing flow was modestly supportive, with a $480mn market-on-close imbalance to buy.
Market turnover was light, with 16.5bn shares traded across US equity exchanges, below the year-to-date daily average of 19.4bn. The session carried a mild risk-off tone, reflected in the underperformance of recent leadership and stronger performance from laggards and heavily shorted areas.
Across asset classes, the broader macro tape also pointed to a more cautious backdrop. The VIX rose 7.95% to 18.87, WTI crude climbed 5.75% to $88.67, and the US 10-year Treasury yield edged 1bp higher to 4.25%. In other markets, gold slipped 0.36% to $4,813, the DXY eased 0.04% to 98.06, and bitcoin gained 2.36% to $76,433.
Market structure and positioning
One of the more constructive micro signals from the session was the decline in ETF activity as a share of total tape, which fell to 25%, the lowest level of the year to date. That compares with readings above 40% through much of March and suggests a healthier market backdrop driven less by top-down macro flow. Top-of-book depth in S&P 500 futures improved to $9.36mn, sharply above the roughly $2mn lows seen last month, although liquidity conditions still have room to normalise further.
The trading desk characterised overall activity as subdued, rating the session a 4 out of 10 in terms of intensity. Internally, desk flow finished -826bps for sale, versus a 30-day average of +42bps. Asset managers were muted, ending as modest net sellers, primarily through trimming energy and consumer discretionary exposure. Hedge funds were more active, finishing as roughly $5bn net sellers, with supply spread across all sectors but concentrated most heavily in macro products, technology, and consumer discretionary, with long sales exceeding short covering.
Earnings and event focus
Attention is now turning to a busy earnings week, with approximately 24% of S&P 500 market capitalisation due to report, making it the second busiest week of the first-quarter earnings season. The reporting mix is particularly concentrated in Communication Services, Energy, and Industrials.
On the macro side, markets are focused on US retail sales today, along with the Senate confirmation hearing for Fed Chair-designate Kevin Warsh. With the FOMC now in blackout ahead of the April 29 policy decision, Warsh’s remarks may receive more attention than they otherwise would, particularly if he offers signals on the balance between rates policy, balance sheet strategy, and the role of productivity assumptions in the Fed outlook.
Derivatives and volatility
The derivatives backdrop remains notable. After reaching the 99th percentile on a one-year lookback a month ago, one-month SPX skew had retraced sharply to the 5th percentile, reflecting both fading geopolitical anxiety and renewed demand for upside participation. That pattern partially reversed during the latest session, with skew bid across the curve, driven by buying in shorter-dated downside protection and selling in longer-dated skew.
Volatility was also firmer on the day and remained well supported despite the relatively tight intraday range. The desk estimates that dealers remain long gamma, which is likely helping to suppress larger market swings and suggests that a more meaningful downside move would probably require a clearer catalyst. In that context, the preferred tactical expression is for a modest drift lower in both spot and volatility, with short-dated put spread collars screening as relatively attractive. Flow in options was generally quieter, but tilted toward more idiosyncratic or micro expressions, with one-month SPX implied correlation falling to the 14th percentile on a one-year lookback. The implied move through the end of the week is 1.35%.
Post-close
In post-market trading, Zions Bancorporation fell 1.5% after reporting results. The key issue appeared to be a miss on net interest income, while guidance for moderately increasing NII over the next 12 months was read as implying some downside versus expectations.
Disclaimer: The material provided is for information purposes only and should not be considered as investment advice. The views, information, or opinions expressed in the text belong solely to the author, and not to the author’s employer, organization, committee or other group or individual or company.
Past performance is not indicative of future results.
High Risk Warning: CFDs are complex instruments and come with a high risk of losing money rapidly due to leverage. 69% and 73% of retail investor accounts lose money when trading CFDs with Tickmill UK Ltd and Tickmill Europe Ltd respectively. You should consider whether you understand how CFDs work and whether you can afford to take the high risk of losing your money.
Futures and Options: Trading futures and options on margin carries a high degree of risk and may result in losses exceeding your initial investment. These products are not suitable for all investors. Ensure you fully understand the risks and take appropriate care to manage your risk.
Patrick has been involved in the financial markets for well over a decade as a self-educated professional trader and money manager. Flitting between the roles of market commentator, analyst and mentor, Patrick has improved the technical skills and psychological stance of literally hundreds of traders – coaching them to become savvy market operators!