SP500 LDN TRADING UPDATE 3/3/26

SP500 LDN TRADING UPDATE 3/3/26
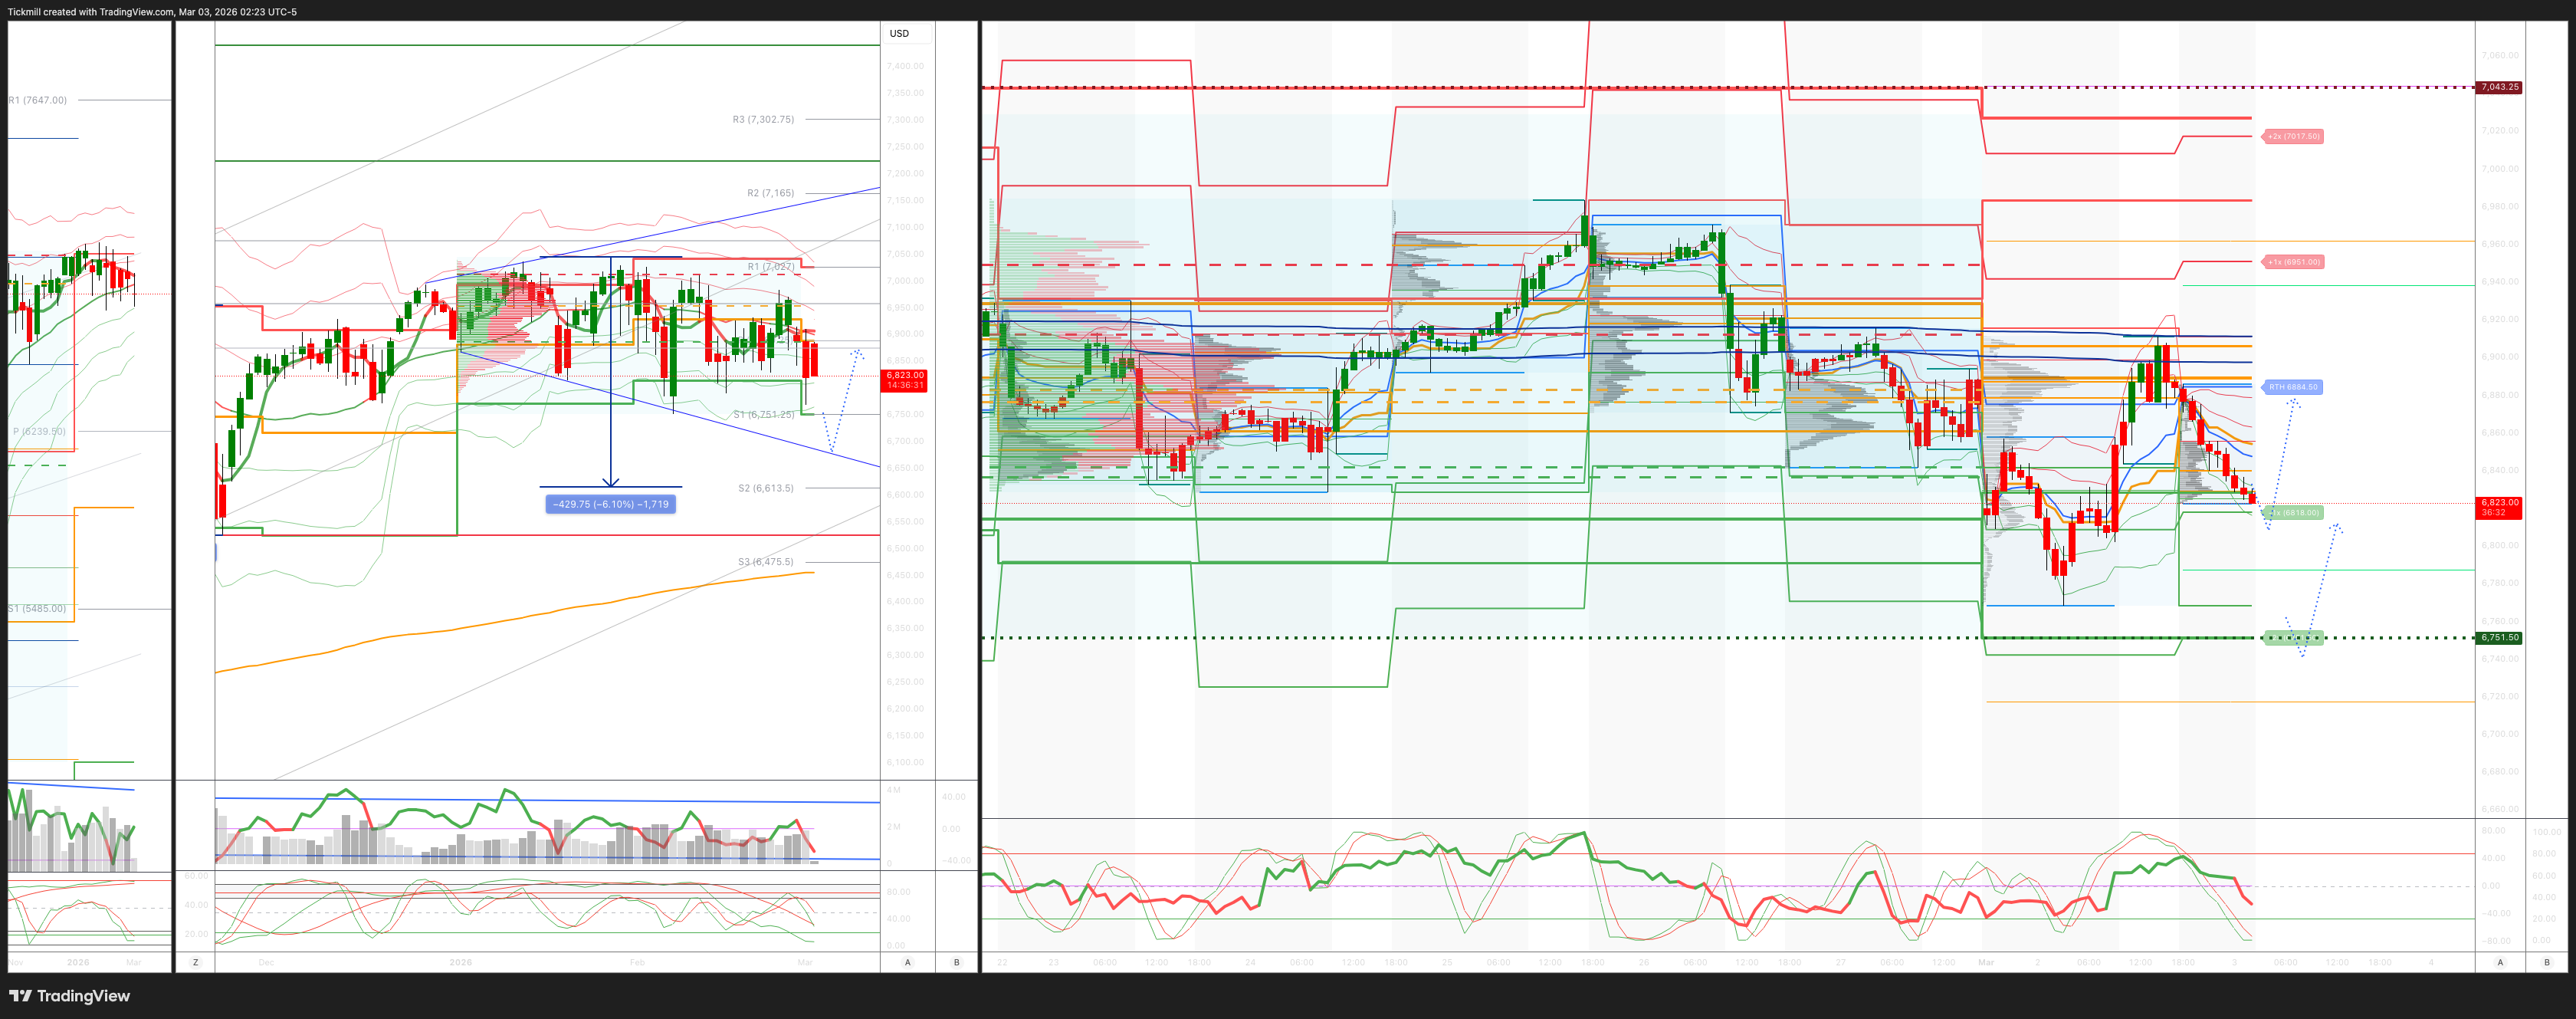
WEEKLY & DAILY LEVELS
***QUOTING ES1! FOR CASH US500 EQUIVALENT LEVELS, SUBTRACT POINT DIFFERENCE***
WEEKLY BULL BEAR ZONE 6940/50
WEEKLY RANGE RES 7031 SUP 6745
Weekly Straddle Range: 143 -point straddle implies a weekly range of [6745, 7031]; monitor 1.5x and 2x moves for key reactions.
March OPEX Straddle: 232.8-point range suggests OPEX-to-OPEX movement between [6677, 7142].
March QOPEX Straddle: 368.55-point range projects [6466, 7203], based on December OPEX.
March EOM Straddle: 255.4-point straddle indicates a monthly range of [6623, 7101]. .
DEC2025 to DEC2026 OPEX straddle spans 945 points, outlining a range of [5889, 7779]."
DAILY VWAP BEARISH 6907
WEEKLY VWAP BEARISH 6917
MONTHLY VWAP BEARISH 6893
DAILY STRUCTURE – BALANCE - 6965/6828
WEEKLY STRUCTURE – BALANCE - 7031/6791
MONTHLY STRUCTURE - BALANCE - 7031/6775
Balance: This refers to a market condition where prices move within a defined range, reflecting uncertainty as participants await further market-generated information. Our approach to balance includes favouring fade trades at the range extremes (highs/lows) while preparing for potential breakout scenarios if the balance shifts.
One-Time Framing Higher (OTFH): This represents a market trend where each successive bar forms a higher low, signalling a strong and consistent upward movement.
One-Time Framing Lower (OTFD): This describes a market trend where each successive bar forms a lower high, indicating a pronounced and steady downward movement.
DAILY BULL BEAR ZONE 6808/18
GAMMA FLIP 6901
DAILY RANGE RES 6951 SUP 6818
2 SIGMA RES 7017 SUP 6751
VIX BULL BEAR ZONE 20
PUT/CALL RATIO 1.24 (The numbers reflect options traded during the current session. A put-call ratio below 0.7 is generally considered bullish, and a put-call ratio above 1.0 is generally considered bearish)
TRADES & TARGETS
LONG ON REJECT/RECLAIM OF DAILY BULL BEAR ZONE TARGET 6884
LONG ON REJECT/RECLAIM WEEKLY RANGE/2 SIG SUP TARGET DAILY BULL BEAR ZONE
(I FADE TESTS OF 2 SIGMA LEVELS ESPECIALLY INTO THE FINAL HOUR OF THE NY CASH SESSION AS 90% OF THE TIME WHEN TESTED THE MARKET WILL CLOSE ABOVE OR BELOW THESE LEVELS)
GOLDMAN SACHS TRADING DESK VIEW - ‘Nowhere To Hide’
S&P rose +4bps, closing at 6,882 with a MOC of $2.8bn to BUY. NDX gained +13bps to 24,993, R2K climbed +90bps to 2,656, while the Dow slipped -15bps to 48,905. A total of 20.96 billion shares traded across all U.S. equity exchanges, surpassing the YTD daily average of 19.34 billion shares. The VIX increased +8.01% to 21.47, WTI Crude surged +6.48% to $71.36, the U.S. 10YR yield rose +10bps to 4.04%, gold gained +113bps to $5,339, the DXY climbed +96bps to 98.55, and Bitcoin jumped +5.40% to $69,210.
The market appeared to look past the U.S./Israel weekend events, with geopolitical risk moves fading. Notably, there were several unexpected market movements, as the broader market rebounded by more than 1% from early session lows. Feedback indicated that many subsectors performed contrary to expectations, with defensives trading down while RTY and non-profitable tech stocks outperformed. Bitcoin rallied strongly from weekend lows (+6% at $69k), triggering a squeeze in crypto-related equities like CRCL, COIN, and GLXY. There was significant positioning and momentum unwinding, with software stocks up and semiconductor leadership down. Despite a +7% rise in oil prices, oil-related equities underperformed. Trading volumes were notably down (NDX constituent volumes off by 10%+), reflecting investor hesitation to make significant portfolio changes after the intraday bounce.
The U.S. 10YR yield backed up +11bps to 4.04%, attributed to a combination of factors: 1) inflationary concerns stemming from higher crude prices, and 2) a reversal following large month-end buying on Friday, when the 10YR yield dropped below 4% for the first time since November. Credit worries and layoff headlines also contributed to expectations of potential Fed rate cuts, with a June cut still uncertain and the first cut priced in for September. ISM Manufacturing data for the morning came in at 52.4, slightly up from 51.5 last month. While new orders slightly declined (56 vs. 57 last month), they remained strong overall. Prices paid surged to 70.5 from 60, marking the highest level since 2022, with qualitative commentary highlighting the impact of tariffs on rising costs.
Market activity was subdued, rated a 3 on a 1-10 scale. The floor ended +240bps to buy compared to the 30-day average of -21bps. Single-stock activity was muted as investors remained cautious. Asset managers’ flows were roughly flat, while hedge funds were net buyers by $1.5bn, driven by scattered covering in macro, tech, and financials. Macro trading dominated micro, with ETF volumes spiking to ~40% of total tape (returning to April 2025 highs) following late-day news about the Strait of Hormuz closure and Iran’s threats to target any ships attempting passage.
Post-close, MDB dropped -20% after hours due to a deceleration in Atlas growth during the quarter and softer full-year total revenue and operating income guidance.
On the derivatives side, attention remained on Iran and geopolitical developments. These initially pushed the market lower but were followed by a midday recovery as volatility premiums eased. The vol panic index rose to ~8.5 in response to weekend events. Ahead of the strikes, risk premiums had already been elevated, with significant demand for downside protection. Front-end skew remained steep at multiyear highs. Index hedges, primarily in SPX, were monetized early in the session, leaving the desk relatively quiet otherwise. Focus now shifts to further developments on Iran and the upcoming NFP report on Friday, with the implied move for the rest of the week estimated at ~1.60%. (Credit: Shayna Peart).
Disclaimer: The material provided is for information purposes only and should not be considered as investment advice. The views, information, or opinions expressed in the text belong solely to the author, and not to the author’s employer, organization, committee or other group or individual or company.
Past performance is not indicative of future results.
High Risk Warning: CFDs are complex instruments and come with a high risk of losing money rapidly due to leverage. 69% and 73% of retail investor accounts lose money when trading CFDs with Tickmill UK Ltd and Tickmill Europe Ltd respectively. You should consider whether you understand how CFDs work and whether you can afford to take the high risk of losing your money.
Futures and Options: Trading futures and options on margin carries a high degree of risk and may result in losses exceeding your initial investment. These products are not suitable for all investors. Ensure you fully understand the risks and take appropriate care to manage your risk.
Patrick has been involved in the financial markets for well over a decade as a self-educated professional trader and money manager. Flitting between the roles of market commentator, analyst and mentor, Patrick has improved the technical skills and psychological stance of literally hundreds of traders – coaching them to become savvy market operators!