S&P500 Daily Action Areas & Price Targets 17/7/26

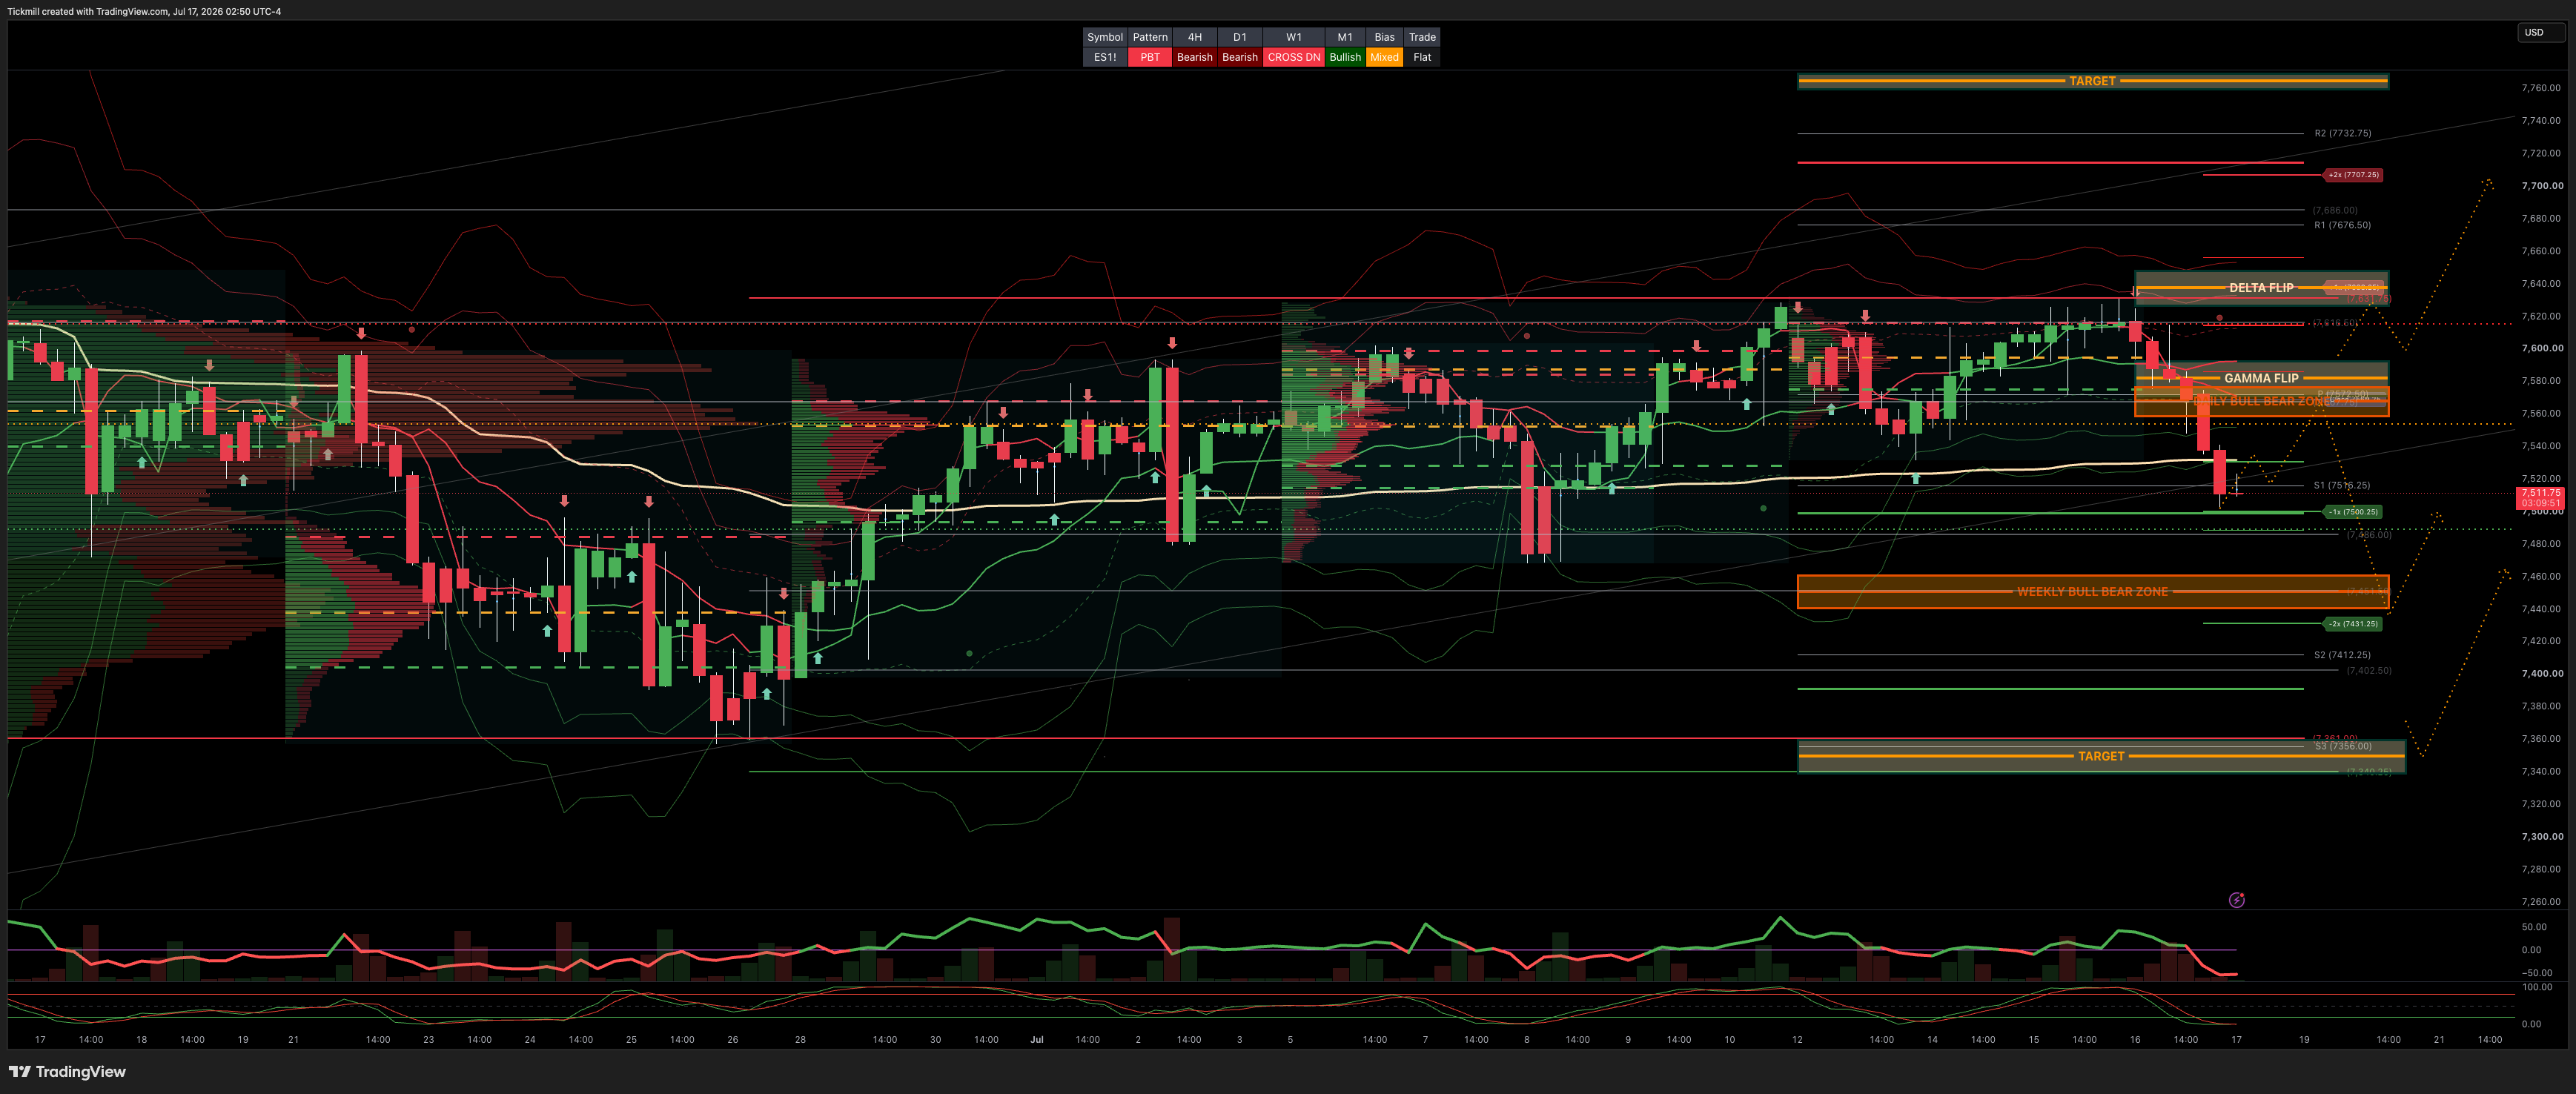
S&P500 Daily Action Areas & Price Targets 17/7/26
***QUOTING ES1! FOR CASH US500 EQUIVALENT LEVELS, SUBTRACT POINT DIFFERENCE***
WEEKLY BULL BEAR ZONE 7460/40
WEEKLY RANGE RES 7710 SUP 7530
MONTHLY RANGE RES 7932 SUP 7384
JHEQX Q3 Collar Short Call Cap: ~7,750 – 7,900 - Long Put Strike: ~7,050 – 7,100 (approx. 5% downside protection) Short Put Strike: ~5,950
DEC2025 OPEX to DEC2026 OPEX is 945 points giving us a range of [5889,7779]
SPX PUT/CALL RATIO 1.17 (The numbers reflect options traded during the current session.) A put-call ratio below 0.7 is generally considered bullish, and a put-call ratio above 1.0 is generally considered bearish.
GS Flow Desk: large S&P 31Aug 7000/7950 strangle in roughly $20mm vega / $115mm premium …My Read – classic “big convexity versus carry” trade: either someone paid a lot to own a wide August move, or someone got paid a lot to bet that the S&P stays comfortably inside the 7000–7950 corridor
DAILY VWAP BEARISH 7585
WEEKLY VWAP BULLISH 7527
MONTHLY VWAP BULLISH 7036
DAILY STRUCTURE - BALANCE 7627/7469
WEEKLY STRUCTURE - BALANCE 7648/7247
MONTHLY STRUCTURE - OTFH - 7199
Balance: This refers to a market condition where prices move within a defined range, reflecting uncertainty as participants await further market-generated information. Our approach to balance includes favouring fade trades at the range extremes (highs/lows) while preparing for potential breakout scenarios if the balance shifts.
One-Time Framing Higher (OTFH): This represents a market trend where each successive bar forms a higher low, signalling a strong and consistent upward movement.
One-Time Framing Lower (OTFL): This describes a market trend where each successive bar forms a lower high, indicating a pronounced and steady downward movement.
DAILY BULL BEAR ZONE 7540/50
GAMMA FLIP 7581
DELTA FLIP 7637
DAILY RANGE RES 7637 SUP 7500
2 SIGMA RES 7707 SUP 7431
VIX BULL BEAR ZONE 17.4
TRADES & TARGETS
SHORT ON REJECT/RECLAIM DAILY BULL/BEAR ZONE TARGET WEEKLY BULL BEAR ZONE
LONG ON REJECT/RECLAIM WEEKLY BULL BEAR ZONE TARGET DAILY RANGE SUP > RTH CLOSE
***ADDITIONAL SETUPS & TARGETS HIGHLIGHTED ON THE CHARTS***
(I FADE TESTS OF 2 SIGMA LEVELS ESPECIALLY INTO THE FINAL HOUR OF THE NY CASH SESSION AS 90% OF THE TIME WHEN TESTED THE MARKET WILL CLOSE ABOVE OR BELOW THESE LEVELS)
GOLDMAN SACHS FICC & EQUITIES TRADING DESK VIEWS
US Equities Color — Momentum Unwind Deepens, but Late Innings in View
US equities finished lower in another session defined by the AI/momentum unwind, even as the broad market held up far better than the index-level tech weakness suggested. The S&P 500 fell 51bps to 7,533, the NDX dropped 162bps to 29,025, the Russell 2000 slipped 38bps to 2,965, and the Dow declined 20bps to 52,553. The close saw a very large $8.25bn MOC to buy, a notable demand signal even on a down day.
Crucially, the equal-weight index diverged sharply from the cap-weighted tech tape. RSP closed up 1% while the high-beta momentum pair (GSPRHIMO) fell 7.5%. This was not a broad risk-off day; it was a continued concentrated deleveraging of the AI/semiconductor complex against a backdrop of relative strength in the rest of the market.
Cross-asset moves reflected the tech-specific nature of the stress. VIX rose 632bps to 16.66, but WTI eased 70bps to $79.04, the 10-year yield was roughly flat at 4.5594%, DXY firmed 27bps to 100.75, gold fell 202bps to 3,978, and Bitcoin declined 111bps to $64,218. Volumes picked up modestly to 17.001bn shares versus a YTD average of 19.521bn, consistent with active repositioning rather than panic liquidation.
The Momentum Unwind — Later Innings, but Not Risk-Free
The dominant story remains the momentum unwind. The high-beta momentum pair fell another 7.5% today and is now down 33% from the highs. Momentum is up only 12.5% YTD after reaching gains of more than 60% less than a month ago. That is an extraordinary round trip and reflects one of the more violent factor unwinds in recent history.
The trigger today was an underwhelming print from TSM, which fell 2%. The important nuance is that TSM did not necessarily deliver bad results in absolute terms; it disappointed relative to very high expectations. That drove further deleveraging across the global semiconductor and AI infrastructure trade. This mirrors the ASML dynamic from the prior session: good-but-not-great numbers into crowded, high-expectation positioning are being punished.
The desk view is that this is now in the later innings of the unwind, for three reasons:
Magnitude relative to history. The move is large on both an absolute and volatility-adjusted basis, consistent with the mature stages of a factor unwind.
Cleaner positioning. Momentum exposure on the PB book has fallen to the 77th percentile over one year, though still the 95th percentile over five years.
Absence of a clear fundamental catalyst. There is no obvious structural break in the AI thesis, even though AI capex concerns are clearly weighing on the complex.
That said, the risk is not gone. The five-year positioning percentile at the 95th shows momentum exposure remains elevated on a longer horizon. If capex disappoints this earnings season or the AI narrative deteriorates more structurally, there is still room for a deeper drawdown. So the desk is signaling that the pain trade is maturing, but it is not calling an unconditional all-clear.
Broadening — The Rest of the Market Is Working
The most important structural signal today was the divergence between the momentum unwind and the broader tape. With RSP up 1% while high-beta momentum fell 7.5%, the market is showing genuine broadening. Capital is rotating out of crowded AI infrastructure and into other parts of the market that had been neglected during the AI-led rally.
Healthcare was a clear example. Med Tech and Tools (GSHLCMDT) rose 200bps, led by ABT +11% after a 7.5 standard deviation EPS move, driven by a modest quarterly beat and an EPS guidance raise. Medtech positioning is very washed out and light, particularly from long-only investors, and the desk views the ABT print as a catalyst to re-engage the space. UNH rose 1% after 2Q earnings and a guide raise, with strength in both OptumHealth and UnitedHealthcare.
Industrials also showed strength, with trucker JBHT squeezing 8% on a big beat and CHRW up 4% on a positive read-through. These moves matter because they show that the earnings-driven broadening thesis is playing out in real time: reasonably valued, lightly positioned cyclicals and defensives are being rewarded for delivering.
This is exactly the kind of rotation that supports index resilience even as the most crowded AI names de-risk. The index is holding near highs not because tech is leading, but because the rest of the market is finally participating.
Flows — Muted but Rotational
The floor was a 4 out of 10 in terms of activity and finished roughly flat versus a 30-day average of +8bps. Asset manager and hedge fund flows both finished approximately flat. Asset manager flows were muted, while hedge funds bought tech and industrials and sold communication services.
The very large $8.25bn MOC to buy is notable on a down day, suggesting meaningful institutional demand into the close even amid the tech weakness. Combined with the rotational hedge fund activity, this reinforces the view that the market is repositioning rather than broadly de-risking. Investors are buying the areas that are working and continuing to reduce crowded AI infrastructure exposure.
Macro — Still Supportive at the Margin
The macro backdrop remained relatively benign. Oil eased modestly to $79.04, providing some relief from the recent geopolitical energy squeeze, while yields were roughly flat and the dollar firmed slightly. With the softer CPI/PPI sequence earlier in the week having pushed the first expected hike out to December, the rate backdrop is no longer the primary source of equity pressure.
That leaves the AI/momentum unwind as the dominant driver. The good news is that the macro tape is not compounding the factor stress. Lower oil, stable yields, and reduced near-term Fed risk mean the broadening trade has room to work as long as earnings continue to cooperate outside the crowded AI complex.
Derivatives — Skew Bid, Monday QQQ in Focus
Derivatives activity reflected the tech-specific nature of the stress. RUT vol caught a small bid in the front and belly of the curve on the equal-weight/small-cap outperformance in spot. NDX and SPX vol closed little changed on the day, but skew was bid across the board, consistent with continued demand for downside protection into the AI unwind and earnings.
The desk likes Monday QQQ options as a way to play either a reversion from the move or a further meltdown in semis. The rationale is specific and clever: Korea is closed tomorrow, and Korea is where much of the current market stress is concentrated, particularly in memory names. Owning Mondays provides a relatively cheap look at the Kospi open on Sunday night. If Korean semis gap in either direction, Monday QQQ options capture that catch-up move.
On the single-name and thematic side, clients bought both downside and upside on the momentum baskets, reflecting genuine two-way debate about whether the unwind is ending or extending. The desk was also active in semis/AI names, with a sizable seller of SKHY Aug 80 puts and a buyer of TSM call spreads. That positioning is interesting because it leans toward the view that the semiconductor selloff is maturing: selling downside puts and buying upside call spreads expresses a constructive stance on names that have been heavily de-risked.
Implied Range Projection
So the market is pricing a range through expiry of approximately: Implied SPX range through expiry: 7,489 to 7,577.
This range remains constructive from a systematic-flow perspective. The lower bound of 7,489 is still comfortably above the key short-term CTA pivot at 7,427. Even a full downside move through expiry would not immediately threaten CTA support. A break below 7,489 would indicate the market is moving beyond the priced range, while 7,427 remains the more important line where systematic selling risk would increase.
On the upside, 7,577 is only modestly above today's close and remains below the recent highs, reflecting the expiry-dominated, lower-vol pricing of tomorrow's session.
Disclaimer: The material provided is for information purposes only and should not be considered as investment advice. The views, information, or opinions expressed in the text belong solely to the author, and not to the author’s employer, organization, committee or other group or individual or company.
Past performance is not indicative of future results.
High Risk Warning: CFDs are complex instruments and come with a high risk of losing money rapidly due to leverage. 69% and 73% of retail investor accounts lose money when trading CFDs with Tickmill UK Ltd and Tickmill Europe Ltd respectively. You should consider whether you understand how CFDs work and whether you can afford to take the high risk of losing your money.
Futures and Options: Trading futures and options on margin carries a high degree of risk and may result in losses exceeding your initial investment. These products are not suitable for all investors. Ensure you fully understand the risks and take appropriate care to manage your risk.
Patrick has been involved in the financial markets for well over a decade as a self-educated professional trader and money manager. Flitting between the roles of market commentator, analyst and mentor, Patrick has improved the technical skills and psychological stance of literally hundreds of traders – coaching them to become savvy market operators!