SP500 LDN TRADING UPDATE 18/9/25

SP500 LDN TRADING UPDATE 18/9/25
WEEKLY & DAILY LEVELS
***QUOTING ES1! CASH US500 EQUIVALENT LEVELS SUBTRACT ~61 POINTS***
WEEKLY BULL BEAR ZONE 6625/15
WEEKLY RANGE RES 6710 SUP 6570
SEP MOPEX STRADDLE - 6260/6639
SEP EOM STRADDLE - 6282/6638
DAILY BULL BEAR ZONE 6660/50
DAILY RANGE RES 6726 SUP 6606
2 SIGMA RES 6781 SUP 6550
VIX DAILY BULL BEAR ZONE 17.5
DAILY MARKET CONDITION - ONE TIME FRAMING HIGHER 6686
One-Time Framing Up (OTFU): This represents a market trend where each successive bar forms a higher low, signaling a strong and consistent upward movement.
TRADES & TARGETS
SHORT ON TEST/REJECT OF WEEKLY RANGE RES TARGET DAILY BULL BEAR ZONE
LONG ON TEST/REJECT DAILY BULL BEAR ZONE TARGET DAILY RANGE RES
SHORT ON TEST/REJECT OF DAILY RANGE RES TARGET DAILY BULL BEAR ZONE
(I FADE TESTS OF 2 SIGMA LEVELS ESPECIALLY INTO THE FINAL HOUR OF THE NY CASH SESSION AS 90% OF THE TIME WHEN TESTED THE MARKET WILL CLOSE AT OR BELOW THESE LEVELS)
GOLDMAN SACHS TRADING DESK VIEWS
U.S. EQUITIES INSIGHT: AS ANTICIPATED
17 September 2025
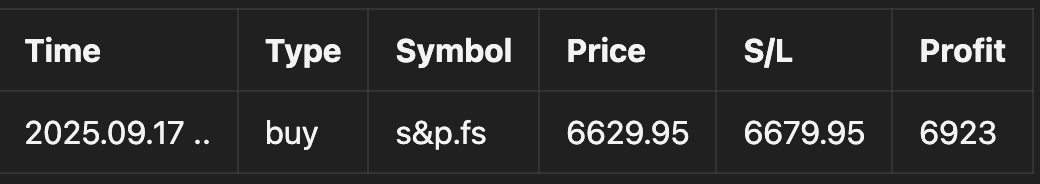
S&P - 10bps closing at 6,600 with a MOC of $1.8b to SELL.
NDX - down 21bps at 24,223,
R2K - up 22bps at 2,425,
Dow - up 57bps at 46,018.
19 billion shares were traded across all US equity exchanges compared to a year-to-date daily average of 16.8 billion shares.
VIX - up 391bps at 15.72,
WTI Crude - down 79bps at $64.01,
US 10YR - up 4bps at 4.07%,
gold - down 84bps at 3,693,
DXY - up 36bps at 96.98,
Bitcoin - down 90bps at $115.8k.
Stocks ended relatively unchanged despite significant volatility beneath the surface, particularly in the Momentum (Non-profitable Tech > Mega Caps) and Size factor (Small > Big) segments. HF VIPs lagged behind Most Short (GSPRHVMS) by 95bps. As anticipated, the Fed enacted a 25bp rate cut, with the September median forecasting three cuts for 2025 by a narrow 10-9 margin, followed by one cut each in 2026 and 2027, leading to a terminal rate of 3.125% (compared to 3.375% previously). The median outlook indicated HIGHER GDP growth through the projection period, higher inflation in 2026, and LOWER unemployment in 2026 and 2027. Overall, the stance remains dovish, although the statement recognized the softening labor market.
Our activity level was assessed as a 6 on a scale of 1 to 10. We ended with a -270bps sell versus a 30-day average of +22bps. Client flows were subdued ahead of the Fed's decision; L/Os were slightly net sellers while HF flows were balanced with some early covering in tight areas. It’s worth noting that factor exposure to Medium-Term Momentum has significantly increased, reaching its highest level since April 2021 (96th percentile over five years). As we enter a Fed easing cycle, we believe the combination of elevated Grosses, relatively low Nets, and increased Momentum exposure suggests potential for laggards to recover (and some shorts to be covered) if the ongoing soft patch in the US economy proves temporary heading into 2026.
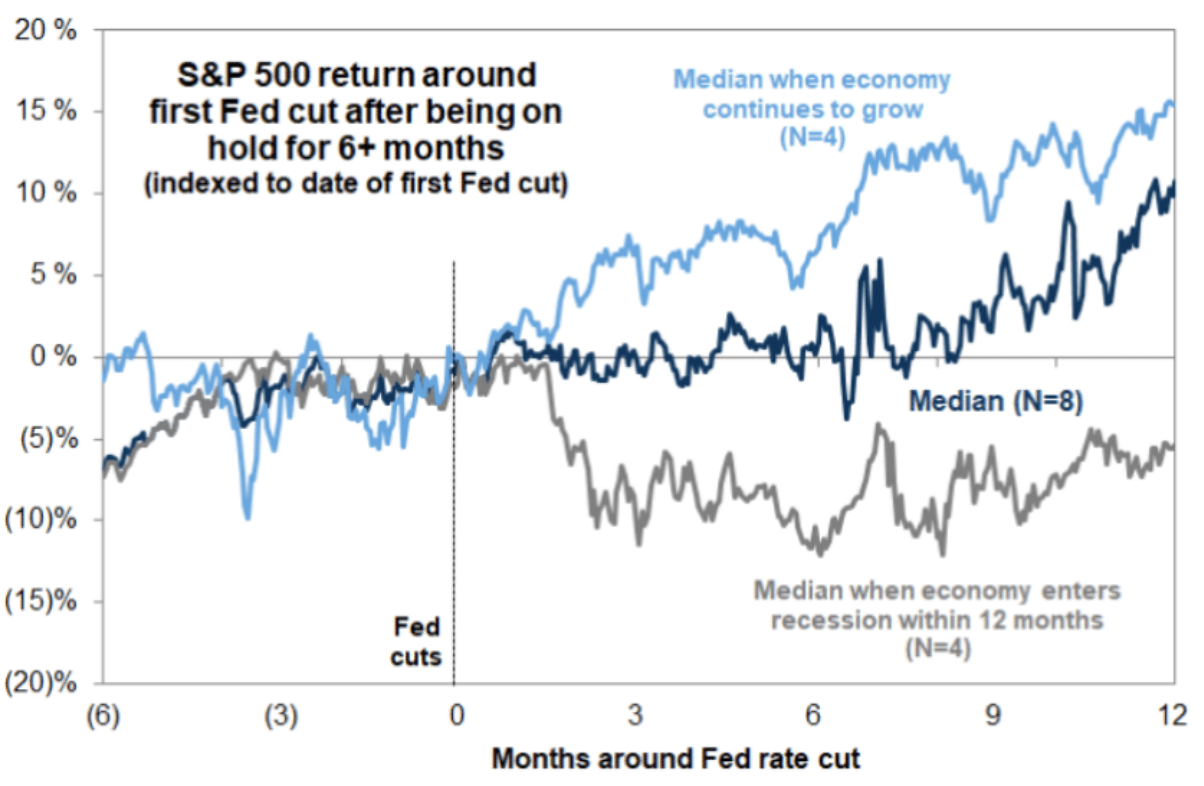
How does the S&P 500 typically react around Fed cuts?
It largely depends on whether the economy continues to expand. Reviewing the last 40 years, the Fed has implemented 8 cuts after being on hold for over 6 months. Here’s a chart detailing the S&P’s performance:
Disclaimer: The material provided is for information purposes only and should not be considered as investment advice. The views, information, or opinions expressed in the text belong solely to the author, and not to the author’s employer, organization, committee or other group or individual or company.
Past performance is not indicative of future results.
High Risk Warning: CFDs are complex instruments and come with a high risk of losing money rapidly due to leverage. 69% and 73% of retail investor accounts lose money when trading CFDs with Tickmill UK Ltd and Tickmill Europe Ltd respectively. You should consider whether you understand how CFDs work and whether you can afford to take the high risk of losing your money.
Futures and Options: Trading futures and options on margin carries a high degree of risk and may result in losses exceeding your initial investment. These products are not suitable for all investors. Ensure you fully understand the risks and take appropriate care to manage your risk.
Patrick has been involved in the financial markets for well over a decade as a self-educated professional trader and money manager. Flitting between the roles of market commentator, analyst and mentor, Patrick has improved the technical skills and psychological stance of literally hundreds of traders – coaching them to become savvy market operators!