Institutional Insights: Goldman Sachs Flow of Funds Update 11/11/25

We've often heard the term "wobble" used, but we perceive it more as a "shuffle." Recent challenging headlines and fundamental developments triggered a brief phase of rotation and reassessment. However, flows into US equities have remained constructive. Below, we break down some of the factors behind last week’s sell-off, emphasizing their temporary nature.
Corporate buybacks are in full swing, providing consistent daily demand for equities. Additionally, a strong seasonal period and positive fund flows are setting the stage for a potential year-end rally. This is further supported by a resilient retail investor base and systematics largely staying on the sidelines for now.
Heading into year-end, we’ll continue monitoring flows and technicals, but the equity market outlook appears clearer. Historical analysis suggests that a weak start to November, following a robust start to the calendar year, is typically bullish through December 31. Specifically, when the S&P 500 delivers a >10% return by November 1 and experiences a negative start to November, the index has historically delivered an average return of 2.82% and a median return of 3.59% by year-end.
The SPX-Yields correlation has now hit a 15-month low, driven by supply from portfolio hedgers. Against this technical backdrop, betting on a continued upward trajectory looks appealing. One strategy we favor is: USD 19Dec25 .SPX>105% & 10ySOFR>ATMF CMS+0.25% @ 6% (+10 Corr, 21%/26% EQ/IR indivs). (Credit to Angela Tang for this insight.)
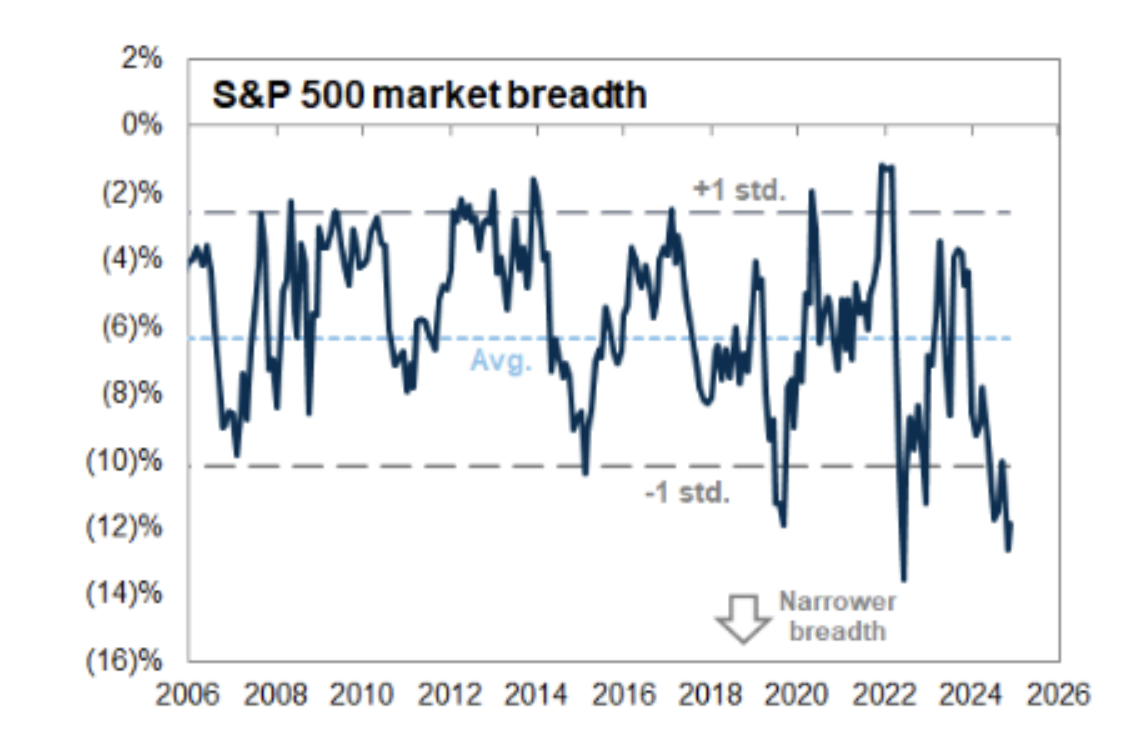
S&P market breadth, measured as the percentage difference between the S&P 52-week high and its median constituent, remains over 1 standard deviation narrower than the 20-year average in our dataset. Although narrow breadth is often viewed as a potential risk, historical data since 1980 shows that following significant declines in breadth, median S&P returns tend to be flat over 1 month, rise by +1% over 3 months, and increase by +10% over 12 months. Currently, market breadth has shown slight improvement and gradual shifts in either direction. In our opinion, this trend supports the case for strategic rotations rather than signaling a structural market issue.
Last week provided a pause in the mega-cap tech-driven rally, as evidenced by a noticeable increase in put versus call volume. This sudden demand for downside protection has historically aligned with corrections in the S&P 500. We would classify last week’s trading as a phase to digest the earnings season and assess specific market segments, rather than a broader reduction in risk exposure. According to GS Prime Brokerage data, overall book gross leverage rose slightly by 0.5 points to 286.6% (74th percentile over the past year), while net leverage remained steady at 79.3% (86th percentile over the past year).
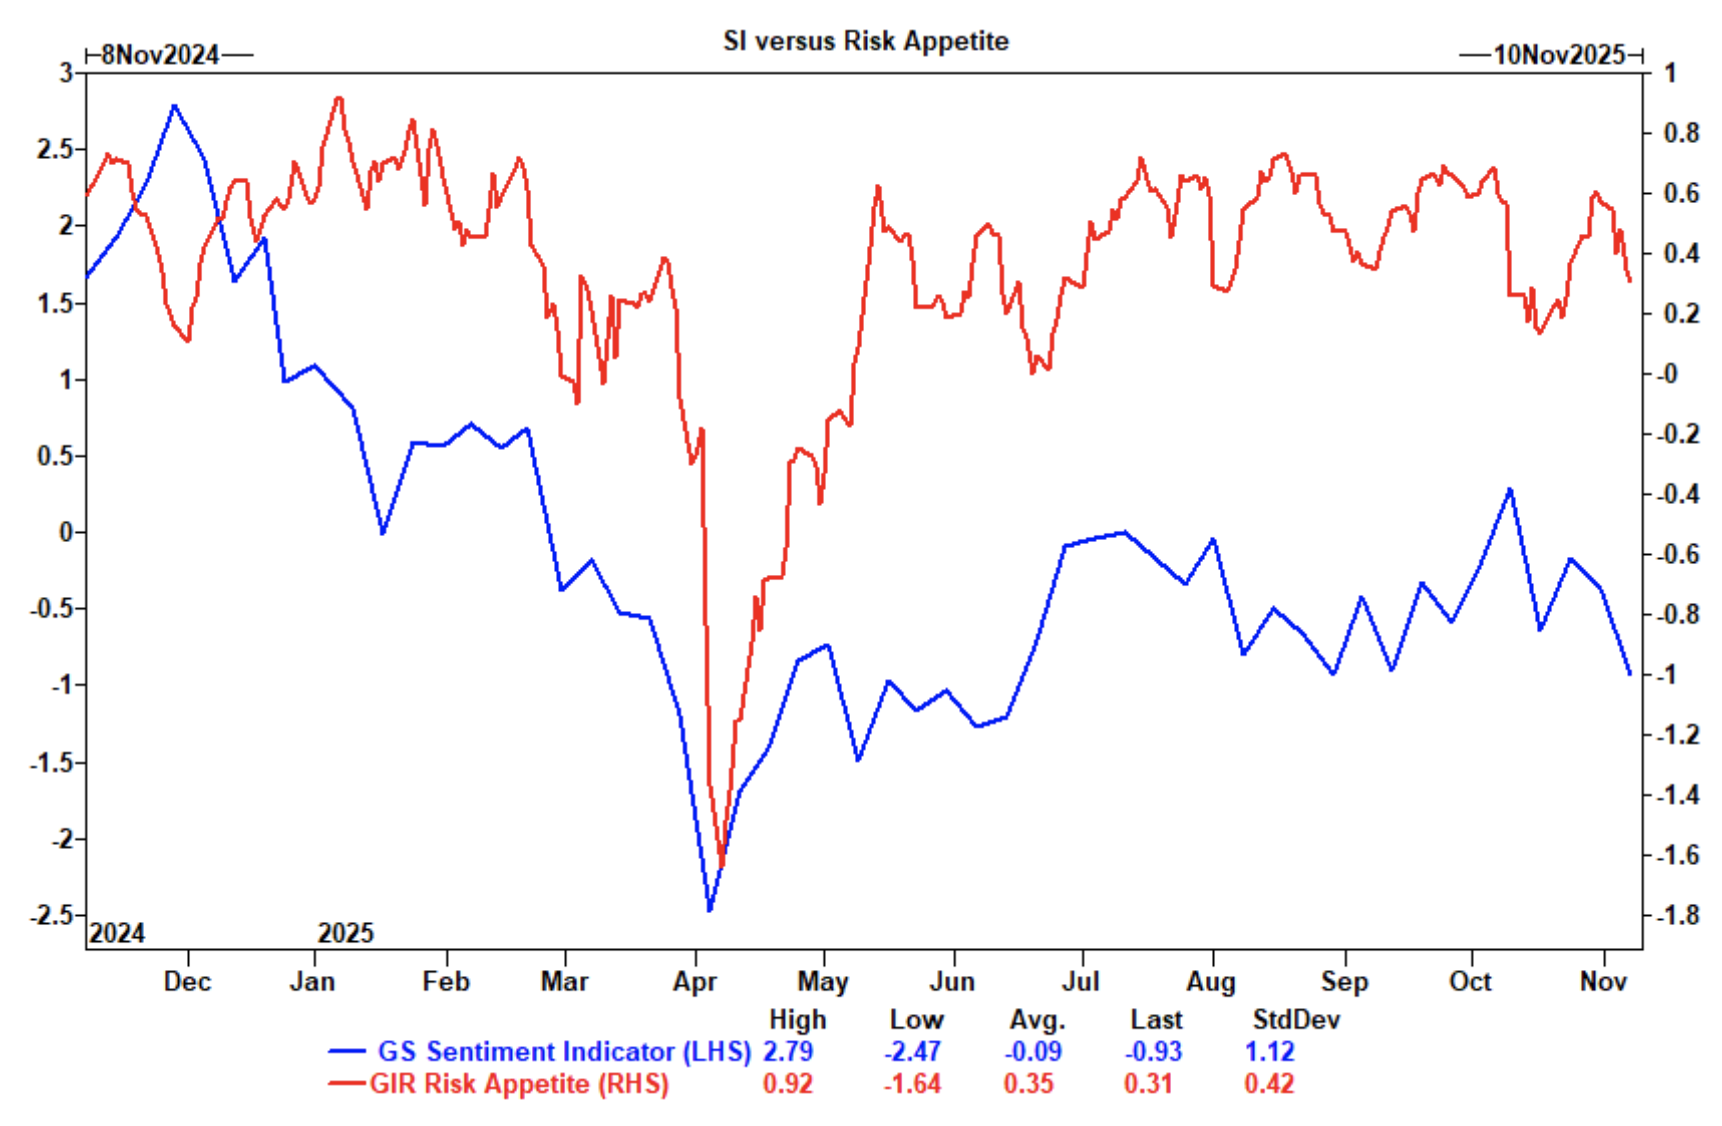
Although sentiment has declined, as indicated by our latest Sentiment Indicator reading dropping to -0.9, our Risk Appetite Indicator—which measures global market risk appetite and aversion using various market variables—remains at the 1-year average. This suggests that last week’s market selloff did not represent a significant decrease in risk appetite or reach extreme levels indicative of market overreaction.
Fund Flows
Net inflows into global equity funds were robust during the week ending November 5, totaling $29 billion compared to $17 billion the previous week. These strong inflows were primarily concentrated in key areas: global benchmark funds, U.S. equity funds, and mainland China equity funds. The inflows to U.S. equity funds were entirely driven by domestic demand. At the sector level, technology funds experienced significant net inflows, while most other sectors saw relatively muted activity.
Investors are buying the tech dip – “Nothing to See Here.”
The Numbers
November-December is typically the strongest seasonal two-month period of the year, yet last week didn’t quite align with that trend. Let’s examine: “What are the year-end returns of the index when the first week of November is down?”
S&P 500 (SPX): When the 1st week of November is down
- Average year-end return: 1.48%
- Median year-end return: 1.61%
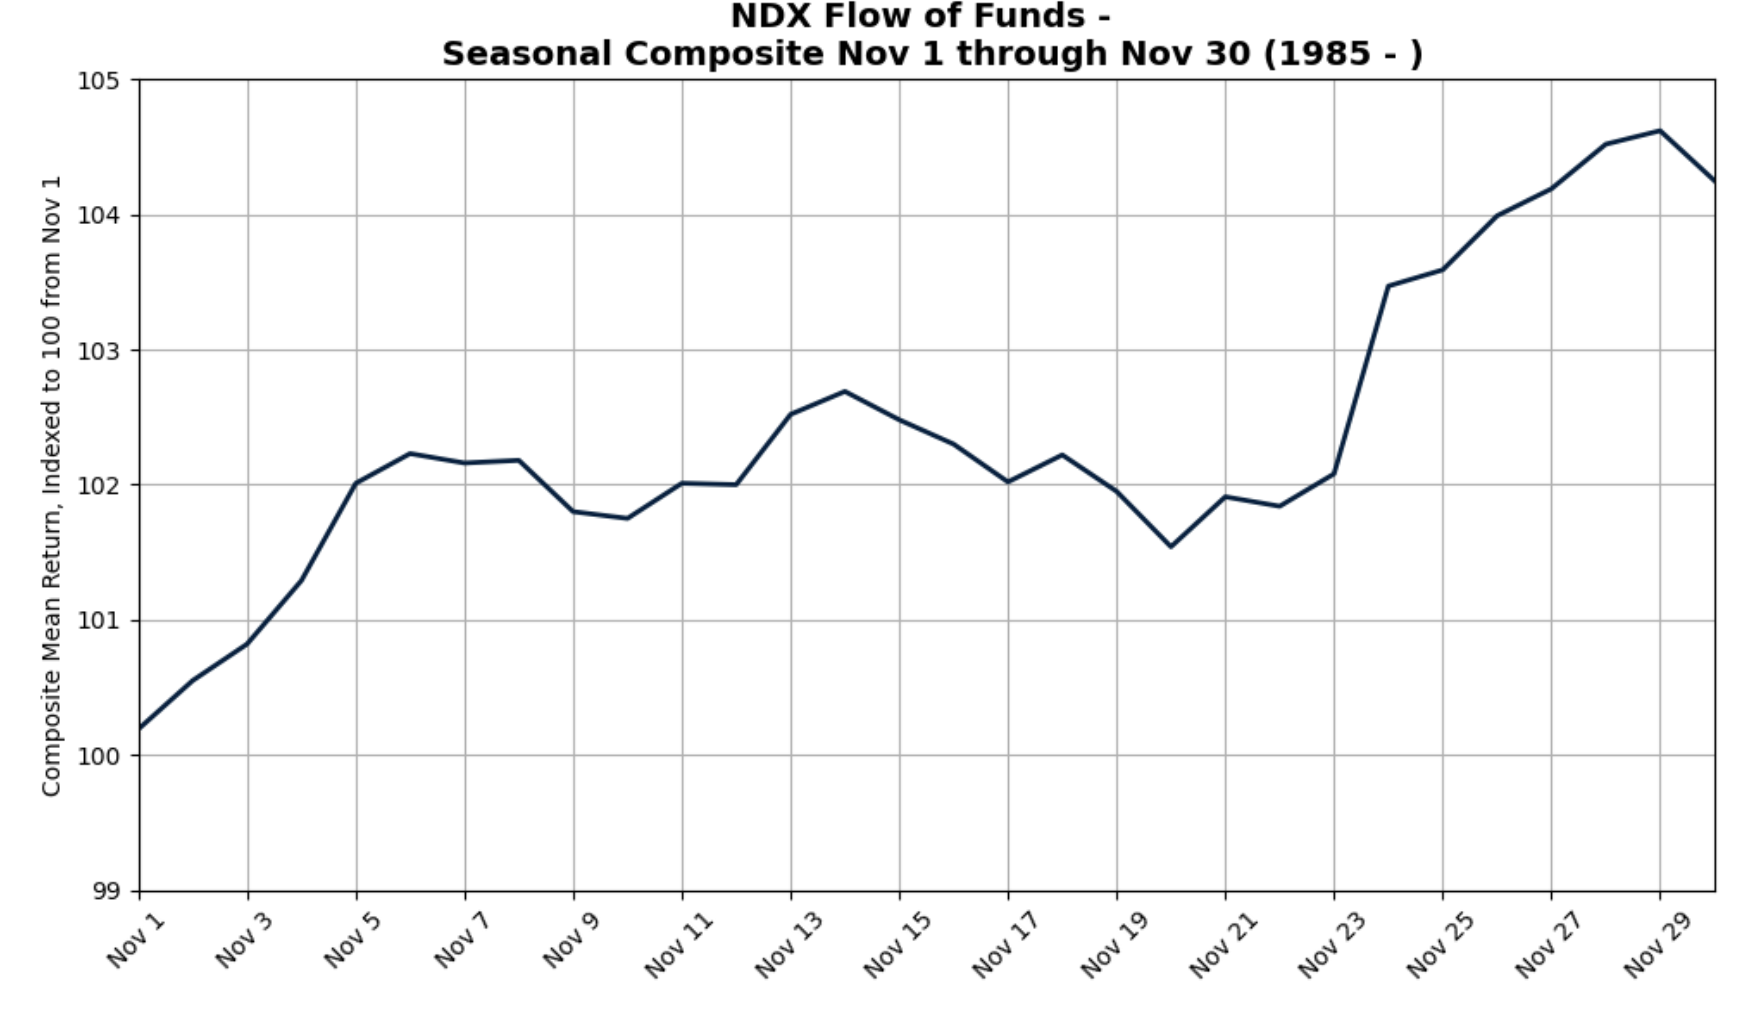
Nasdaq 100 (NDX): When the 1st week of November is down
- Average year-end return: 1.24%
- Median year-end return: 1.51%
Now, let’s refine the question slightly: “What are the year-end returns of the index when the first week of November is down after gaining 10% since November 1?”
S&P 500 (SPX):
- Average year-end return: 2.82%
- Median year-end return: 3.59%
Nasdaq 100 (NDX):
- Average year-end return: 1.80%
- Median year-end return: 1.84%
Historically, it’s not unusual for the first week of November to decline following a positive run leading up to that point. Combined with the continued positive flow of funds into U.S. equities, this supports our confidence that the Santa rally remains on track for this year.
CTAs
Systematic investors gained attention as the S&P breached the short-term threshold of 6702 on Friday, which ultimately did not hold, closing above that level. This limited the unlocked selling pressure from CTAs, which have been a minor source of supply in US equities and continue to remain so for now.
We anticipate systematic cohorts will play a more significant role in short-term trading and will closely monitor any substantial changes in flow estimates.
1-Week Projection:
- Flat Market: Sellers $13.23B ($1.53B out of the US)
- Rising Market: Sellers $5.1B ($1.72B out of the US)
- Declining Market: Sellers $49.05B ($15.17B out of the US)
1-Month Projection:
- Flat Market: Sellers $43.15B ($18.33B out of the US)
- Rising Market: Buyers $15.19B ($1.14B into the US)
- Declining Market: Sellers $213.22B ($75.72B out of the US)
Disclaimer: The material provided is for information purposes only and should not be considered as investment advice. The views, information, or opinions expressed in the text belong solely to the author, and not to the author’s employer, organization, committee or other group or individual or company.
Past performance is not indicative of future results.
High Risk Warning: CFDs are complex instruments and come with a high risk of losing money rapidly due to leverage. 71% and 74% of retail investor accounts lose money when trading CFDs with Tickmill UK Ltd and Tickmill Europe Ltd respectively. You should consider whether you understand how CFDs work and whether you can afford to take the high risk of losing your money.
Futures and Options: Trading futures and options on margin carries a high degree of risk and may result in losses exceeding your initial investment. These products are not suitable for all investors. Ensure you fully understand the risks and take appropriate care to manage your risk.
Patrick has been involved in the financial markets for well over a decade as a self-educated professional trader and money manager. Flitting between the roles of market commentator, analyst and mentor, Patrick has improved the technical skills and psychological stance of literally hundreds of traders – coaching them to become savvy market operators!